Monitor your system with Glances
- Aug 27, 2024
- 1 min read
Glances is a comprehensive system monitoring utility designed to deliver detailed process information in a concise and adaptable format. It offers both curses-based and web-based interfaces that dynamically adjust to various screen sizes.

Quickstart
Glances usually provides three modes.
Standalone
Client
Web server
In this article, we will be discussing only standalone mode and client mode.
Standalone Mode
To get started with standalone mode, you simply need to open glances in your system terminal:
$ glances
It is also possible to display RAW (Python) stat directly to stdout, by:
$ glances --stdout cpu.user,mem.used,load,network.wlp2s0.bytes_all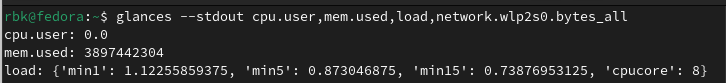
If you need, you can also withdraw your system information in CSV format by using stdout-csv command in glances:
$ glances --stdout-csv now,cpu.user,mem.used,loadOr, in JSON format, by using the stdout-json command:
$ glances --stdout-json cpu,mem
All the information will be displayed in one line per stat per refresh. You can also change the refresh interval.
Client Mode
If anyone want to run the glances on a remote device, called client. Then you can easily access your cloud server information by using this command:
client$ glances -c @server
where @server is the hostname or the IP address of the server. To find more information on login to our servers, please read our blog on login to Uni-Datacenter cluster or contact your system admin.
In case if you find any issue in login or accessing to your system. Please contact us at admin-help@uni-datacenter.com